After a few years earlier this decade, when the average salary for physicians either dropped completely or rose only slightly, the past two years have been much better for doctor compensation. A year after salaries rose by 3.6% in 2025, the latest numbers for 2026 show the average increase for the past year was 3.2%. And now, more physicians say they feel like they're fairly paid.
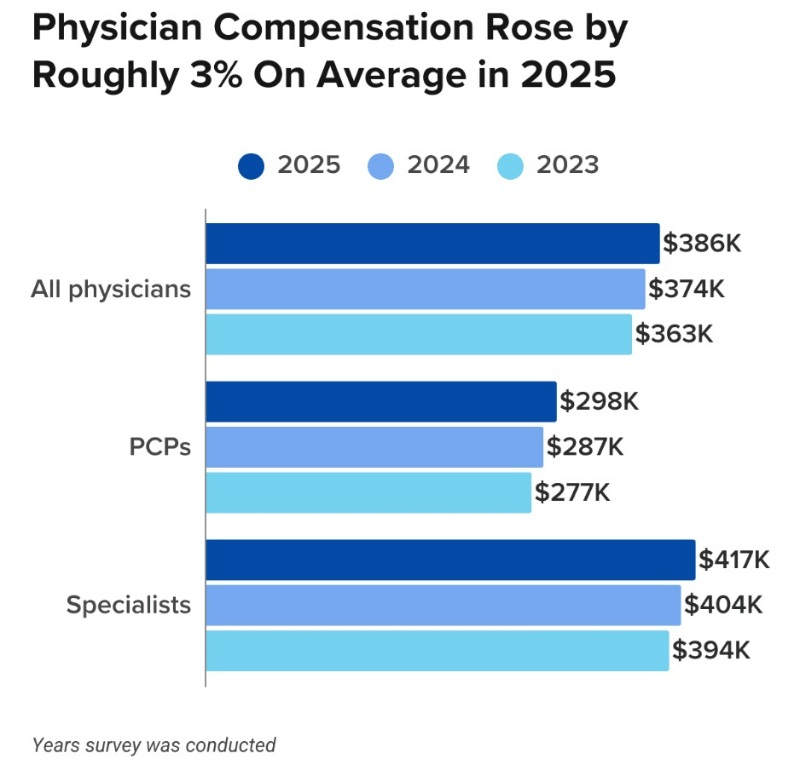
According to the newly released 2026 Medscape Physician Compensation Report, the average physician salary is now $386,000, a rise from $374,000 one year ago and $363,000 from two years ago. Considering average salaries dropped by 2.4% in 2023 and that the average rise in salaries for 2024 was one of the lowest in 14 years, the latest news continues a two-year trend where doctors are getting paid higher salaries while slightly outpacing inflation. The rise in income that Medscape found after receiving survey results from nearly 6,000 people across 29 specialties now shows that eight specialties have risen above an average of $500,000.
Meanwhile, the 2025 Doximity Physician Compensation Report showed that physicians had increased their pay by 3.7% in 2024 (after an increase of 6% in 2023 and a decline of 2.4% the year before). Still, Doximity said that, when adjusted for inflation, Medicare physician payment had decreased by 33% since 2001.
Wrote Doximity:
“This environment underscores that, for many physicians, real earnings have not kept pace with rising costs and declining payment rates.”
In 2022, physician income and a doctor's purchasing power were hurt by inflation that reached a high of 9.1% that summer. That meant a doctor's net worth also probably decreased, particularly since stocks and bonds both had terrible years in 2022. But inflation stabilized in 2023, and the S&P 500 had back-to-back years of 20%+ gains. In 2025, the S&P posted a 16% gain.
A majority of physicians (53%) who were surveyed by Medscape in the 2026 survey said they felt they were “fairly paid.” That's a jump from 2025, when only 48% of doctors answered yes to the question of whether they were paid fairly, which was “the most dispirited response we had received in 10 years of posing that question in surveys,” Medscape said. But that majority of positivity has an asterisk. When 53% answered that they felt they were paid fairly, that was based on their individual salary. According to Medscape, 61% of respondents, the same percentage as last year's survey, said the medical profession as a whole is underpaid in the US.
As one respondent said this year, “Physicians are underpaid for the knowledge and training required and the stress and liability they endure.”
In the 2025 Medscape survey, 62% said that most physicians are underpaid, while 33% believe they're paid just right. The other 5% thought most physicians are paid too much. To compare those numbers with Americans who were surveyed in 2021, only 11% thought doctors were underpaid.
According to Doximity’s latest data, which was gathered with the help of 37,000 US physicians from January 2024-December 2025, the gender pay gap increased slightly to 26% after it had narrowed to 23% in 2023 (it was 26% in 2022 and 28% in 2021), as male doctors earn about $121,000 more than their female colleagues per year (it was a $102,00 in 2023 and a $110,000 difference in 2022). That disparity also could have led to more cases of physician burnout.
“One of the most critical steps to closing the physician gender pay gap is raising awareness of its existence,” Doximity wrote in 2024. “In a survey of over 1,000 physicians, conducted in February and March 2024, about half (nearly 52%) said they believe there is a disparity in how men and women physicians are compensated. However, gender appears to impact this belief. While nearly 75% of women physicians surveyed believe there is a pay disparity, fewer than 30% of men physicians also believe this is true.”
The latest Medscape data also shows the pay gap has only increased, as male doctors averaged $429,000 and female doctors averaged $327,000, a $102,000 difference. In the previous year's survey, male and female doctors had a $98,000 difference, and in the year before that, the gap was $90,000. As Medscape wrote, “In short, if you were looking for progress with pay differentials for female physicians—be they structural or based on individual doctors' career choices—you won't find it in these data.”
Still, doctors are paid more than just about anybody else in the US. As reported by USA Today in late 2024, of the 20 US jobs with the highest average pay, 16 of those are filled by physicians (dentists and dental specialists make up the other four spots).
Average Doctor Salary
In reality, the average doctor's salary of $386,000 isn't all that useful to know.
As an example: according to the latest Doximity report, the average pediatric endocrinologist makes $230,426 per year. The average neurosurgeon makes $749,140. That's a difference of about $520,000. Which, when comparing those two specialties, means absolutely nothing. Plus, consider that, according to the 2026 Medscape survey, the average primary care physician makes $298,000 vs. a specialist who makes $417,000. That's also a pretty big difference. Here's a quick look at general compensation from Medscape's most recent survey.
Medscape Physician Compensation Report 2026
It's almost certainly more useful to know the average in a doctor's specialty as opposed to the salary of a physician in general.
Intraspecialty Pay vs. Interspecialty Pay
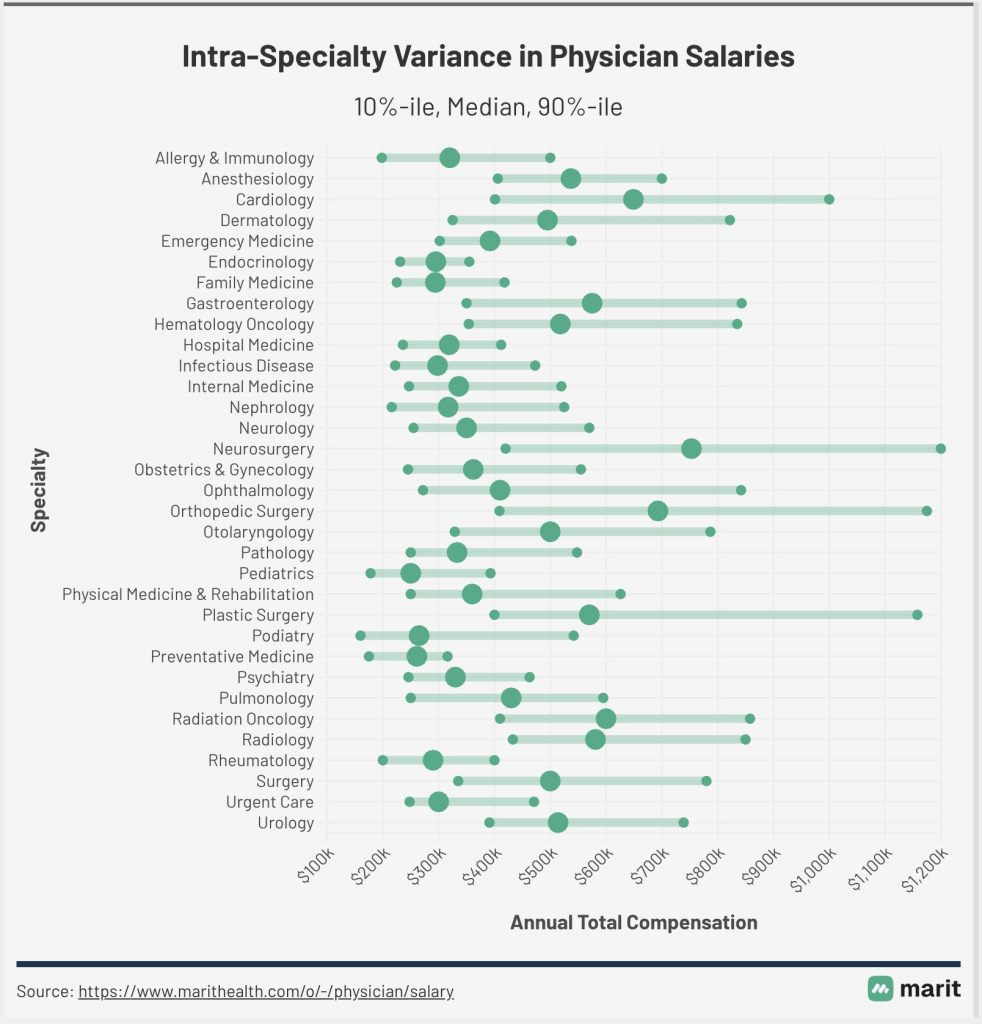
As Dr. Jim Dahle has repeatedly pointed out, “One of the things I have noticed that no one ever seems to talk about is that intraspecialty pay variation is higher than interspecialty pay variation.”
As Jim noted in a previous post, here’s a chart from 2015 that shows the results of an emergency medicine salary survey. The salaries are outdated, but the general point remains.

He wrote:
“Look at the 10th percentile for employees—$213,000. Now, look at the 90th percentile for partners—$510,000. Difference? $297,000. GREATER than the difference between the average pediatrician and the average plastic surgeon!
The ability to increase pay and increase it substantially solves a ton of financial problems that real doctors run into and email me about all the time. It's way easier to pay off your student loans or mortgage on twice the income. Even after-tax, it's much easier to become financially independent or have a dignified retirement or send your kids to the college of their choice when you can double your income.”
Marit also has an up-to-date chart that shows how wide the ranges can be, especially in cardiology, neurosurgery, plastic surgery, and orthopedic surgery. Here's a 2025 example of that intra-speciality variance.
How Much Do Doctors Make an Hour?
Physician income information is relatively easy to find, but work hours information is notoriously difficult. The only information that combined physician work hours with their income is from a survey in JAMA published in 2003 (which obviously uses even older data).
The below physician salary per hour chart combines the JAMA data with Medscape’s 2025 survey, and it's adjusted for the decreased work hours in each specialty. This chart (possibly erroneously) assumes that all physicians work 48 weeks a year.

Doctor Salary by Specialty
One interesting thing about salary surveys is that they are garbage in/garbage out. Average specialty pay varies significantly between surveys. Before we focus on the Doximity numbers, which you'll find in the paragraphs below, compare and contrast those numbers with the average annual earnings by specialty from the 2026 Medscape survey. Also notice the eight specialties that now average more than $500,000 per year, up from four specialties last year.
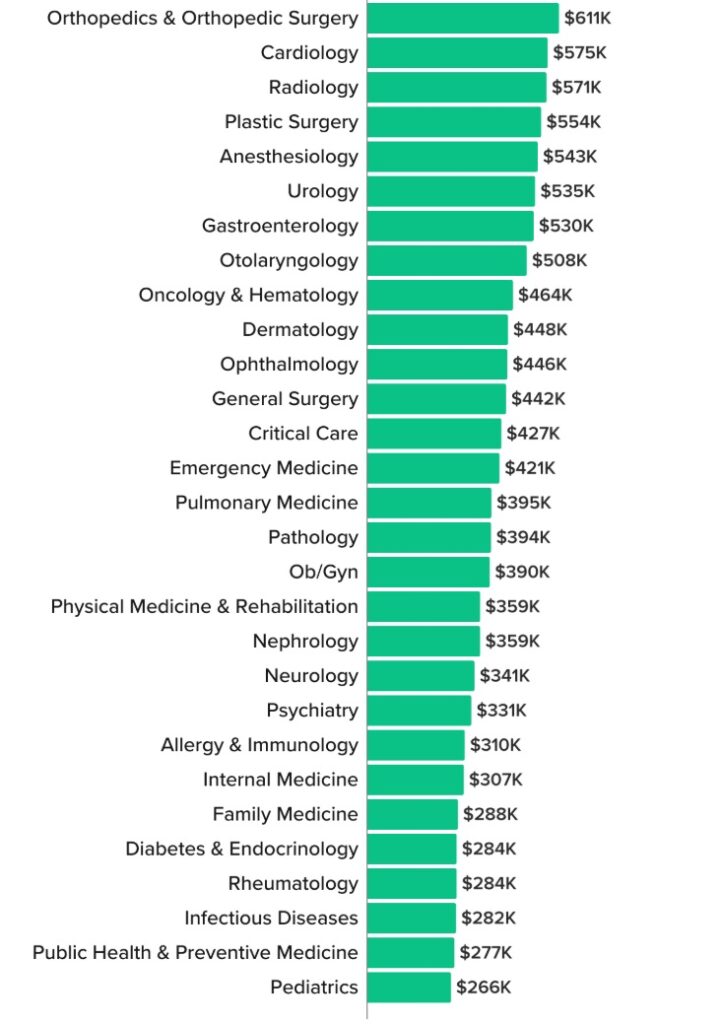
Medscape says infectious disease doctors make $282,000. Doximity says $320,000. That's a 13.5% difference. Medscape says orthopedists make $611,000. Doximity says $679,000, 10% more. What is a new grad or even an established doc who wants to negotiate a contract supposed to do with that much variation between averages (besides using the Doximity survey when negotiating)? What if you're a neurosurgeon or CT surgeon, and Medscape doesn't report on your specialty? Or you don't see your specialty listed on Doximity? Are you stuck paying to get MGMA data (or hiring a contract management firm)? Is that data even any better than these surveys?
Marit also provides physician salary data, including salary information for newly graduated physicians. The vision of the company is “to build the largest, most accurate, community-powered source of salary data in medicine—and make it free for all clinicians” by getting doctors to input their own compensation numbers. Here are some of the latest numbers from Marit, many of which dwarf the numbers provided by Medscape's 2025 survey (click to enlarge the photo).

For even further exploration, here are several individual specialties we've put together in recent years, how much money those doctors make, and whether they think their income is fair:
- How Much Does a Pediatrician Make?
- How Much Does a Radiologist Make?
- How Much Does an Anesthesiologist Make?
- How Much Does a Psychiatrist Make?
- How Much Does a Neurologist Make?
- How Much Does a Cardiologist Make?
- How Much Does a Dermatologist Make?
- How Much Does a Urologist Make?
- How Much Does a Pathologist Make?
- How Much Does a Plastic Surgeon Make?
- How Much Does an Oncologist Make?
- How Much Does a Nephrologist Make?
- How Much Does an OB-GYN Make?
- How Much Does a Rheumatologist Make?
- How Much Does a Family Medicine Doctor Make?
- How Much Does a Sports Medicine Doctor Make?
- How Much Does a Pulmonologist Make?
- How Much Does a Physiatrist Make?
- How Much Does a Hospitalist Make?
- How Much Does an Orthopedic Doctor Make?
- How Much Does an Orthopedic Surgeon Make?
- Doctor vs. Dentist Salary
- Where Do Millennial Doctors Make the Most Money (and How Much Do They Make)?
Highest-Paid Doctors
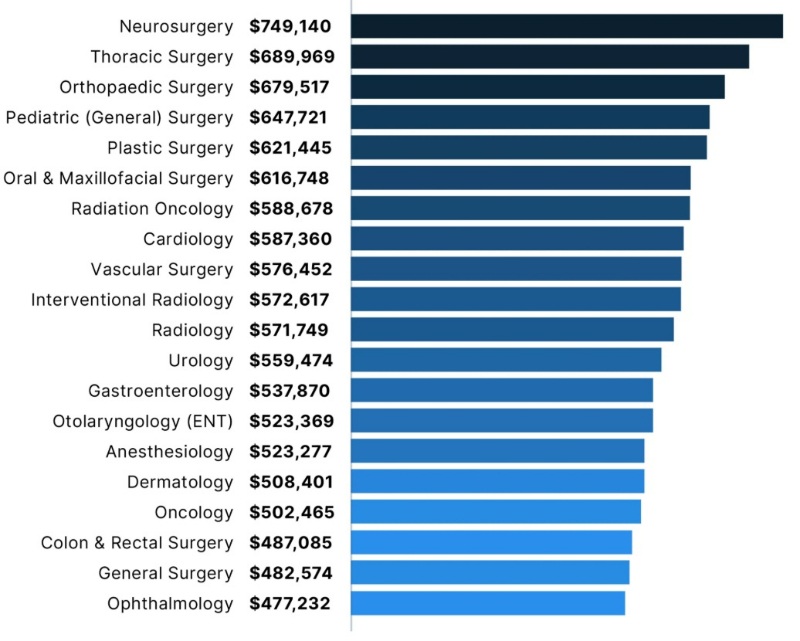
Now, for the Doximity survey numbers that tell us the highest-paid and the lowest-paid doctors. When it comes to the top-earning specialties, those in surgical and procedural specialties dominated the list, and doctors who earn the least mostly practice in primary care and pediatrics.
So, how much do doctors make? Here’s what Doximity found for 2025.
Lowest-Paid Doctors
And here are the specialties that earn the lowest salaries.
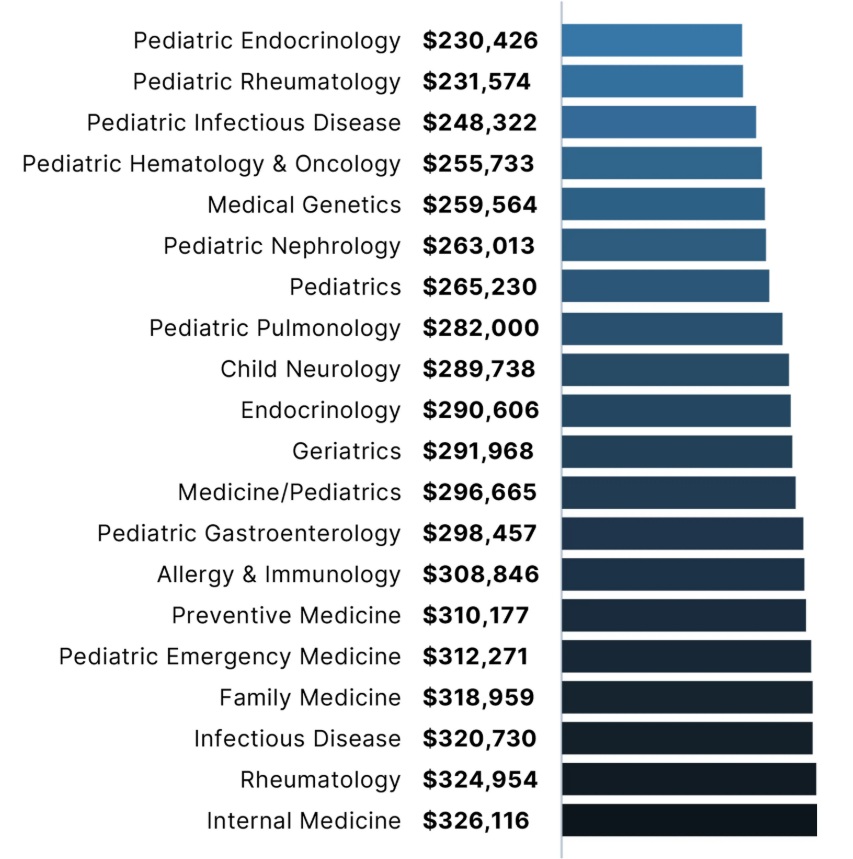
Keep in mind that these charts are of the top 20 highest and lowest average doctor salaries. For specialties like psychiatry, neurology, and geriatrics, those average salaries range from about $291,000 to about $360,000.
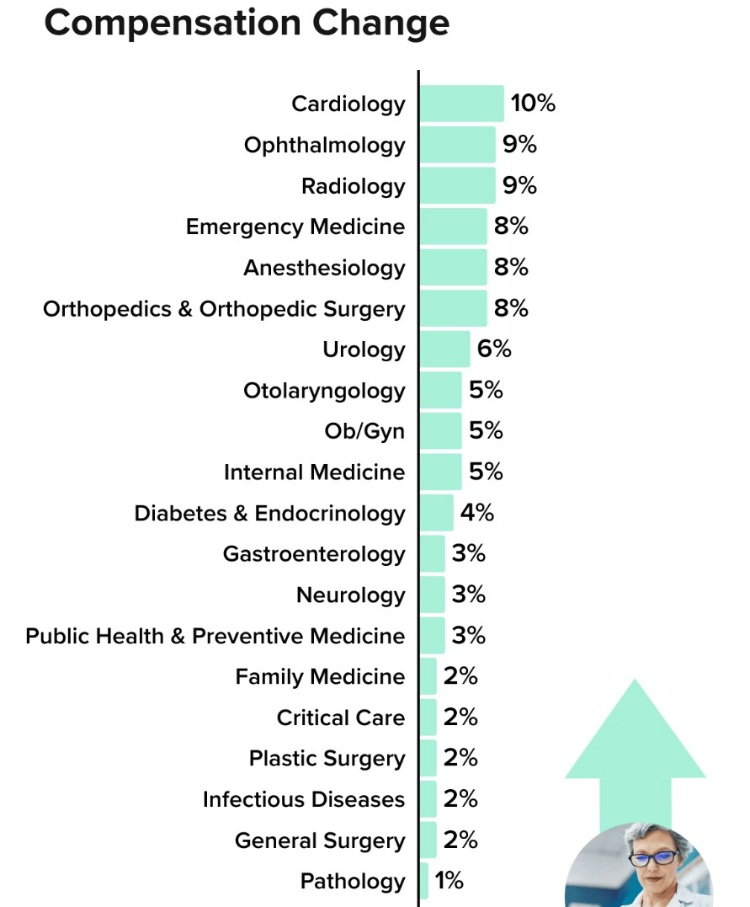
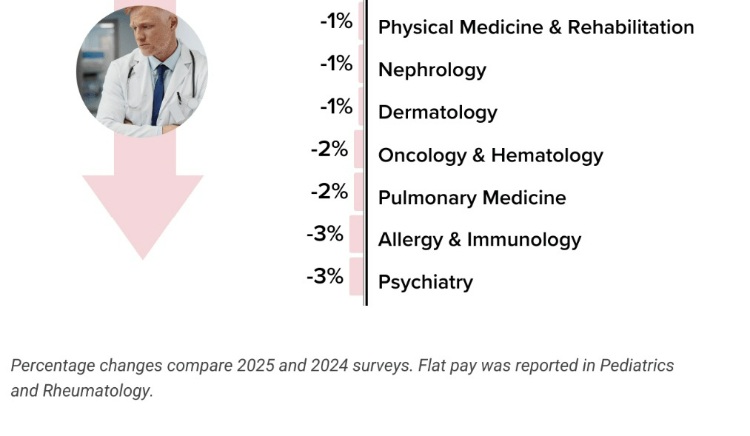
As for which specialty's salaries are increasing and decreasing the most, here's a chart put together by Medscape in its 2026 survey.
Doctor Salary by State and Region
One way to get closer to financial independence is to practice geographic arbitrage, where a doctor lives in a lower-cost-of-living area and draws a higher salary where the need for physicians might be greater than in the big cities on the coasts. The following chart from Medscape in 2023 seems to show that geoarbitrage is not a myth.

Obviously, a doctor living in New York City is going to have a much higher cost of living than a physician who's residing in Weyauwega, Wisconsin. The fact that a doctor in the Badger State probably brings home more money than a physician in the Big Apple is also another point in favor of practicing geographic arbitrage.
In 2026, Medscape released this chart, showing that US doctors make more money in the Midwest part of the country.
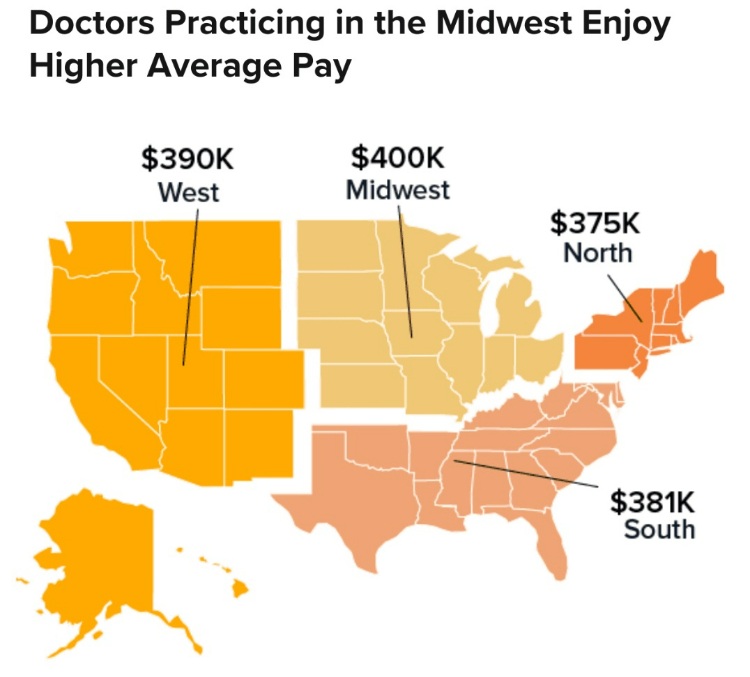
As Medscape noted in 2025, “hospitals in rural states with fewer doctors per capita must ramp up their base salary, signing bonus, and loan-repayment options to compete with big-city markets that offer lifestyle advantages.”
Doctor Salaries by Employment Setting
The setting in which a doctor practices also heavily affects how much they earn. As you can see below, via the Doximity survey, the difference between practicing in a single-specialty group vs. working for an urgent care center can be nearly $173,000 a year in 2025.
- Single Specialty Group: $477,000 (a 3.5% increase from last year)
- Multi-Specialty Group: $462,000 (a 3.4% increase from last year)
- Solo Practice: $458,000 (a 3.4% increase from last year)
- Hospital: $439,000 (a 2.6% increase from last year)
- Health System/IDN/ACO: $439,000 (a 2.8% increase from last year)
- Health Maintenance Organization: $412,000 (a 1.5% increase from last year)
- Academic: $382,000 (a 4.7% increase from last year)
- Urgent Care Center/Chain: $308,000 (a 6.9% increase from last year)
- Government: $303,000 (a 1.7% increase from last year)
Need tips for how to increase pay in your specific specialty? Jim has some ideas.
There's plenty more to read in the entire Doximity report—which also includes information on physician compensation in different metro areas, cities with the fastest-growing doctor salaries, and the impact of physician shortages. For comparison, here's Medscape's Physician Compensation 2026 Report.
What do you think? Are you surprised by any of these numbers? Have you found a way to increase your pay in your specialty?
[This updated post was originally published in 2022.]