By Dr. James M. Dahle, WCI Founder
What people really want, including me, is to do no work whatsoever and to pay no fees whatsoever but yet have someone else do all their work for them. So I will begin by pointing out the obvious—that our desired outcome, whether actually vocalized or not, is not realistic. You must either do some work, you must pay someone else to do some work, or you must suffer the consequences of the work not being done.
Portfolio rebalancing is one of many “investing chores” you will need to master if you wish to be a do-it-yourself investor. Other chores include:
- Setting goals and running projections
- Designing your portfolio
- Mastering your available retirement accounts
- Investing your money each month
- Calculating your returns each year
- Taking out Required Minimum Distributions once you turn 70 1/2
- Doing IRA rollovers/transfers as needed
Lots of chores there. None are particularly hard. In my opinion, none are worth paying thousands of dollars a year to someone else to do for you. But l apparently have no problem paying someone $600+ to winterize my boat, change the oil and filter, and swap out the impeller. So if you view portfolio management like I view boat maintenance and have a few thousand dollars a year you can blow on making your life more convenient, then go for it. Otherwise, you'll need to do these chores yourself.
Simple Portfolio Rebalancing Spreadsheet
Rather than just giving you a fish, I prefer to teach you how to fish. But if you're just looking for free fish, here's your first one:
Basic Portfolio Rebalancing Spreadsheet
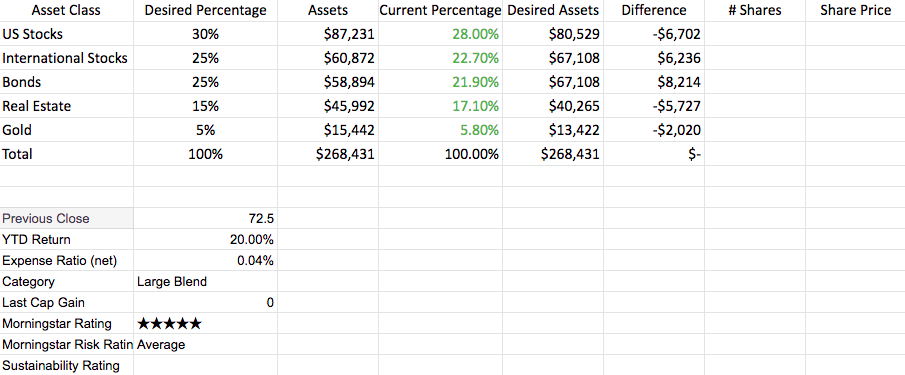
Here's what it looks like:
Yup. That's it. If you cannot master this, better go get yourself an advisor. Let's go through this DIY portfolio rebalancing tool step by step.
First, type the six categories for the columns into row 1. If you like, you can enlarge that row and “wrap text” for each of the first rows of each column to make it a little prettier. You'll notice I also changed the width of the columns (at the top of the spreadsheet, just above the first row) to make it pretty.
Next, type each of your asset classes into the first column. Everyone's asset allocation will look a little different. If you only have a single asset class (or use a single balanced, target retirement, or lifestrategy fund) then you don't need this spreadsheet at all. If you have two asset classes in your portfolio, you'll have two rows here. If you have ten asset classes in your portfolio, you'll have ten rows. If you have fifteen asset classes in your portfolio, get rid of a third of them, they're not doing you any good. 🙂 In this case, we're doing a portfolio that has five asset classes as you can see above.
Next, refer to your written investing plan for the desired percentages of your assets and put them down for each asset class in the portfolio. What? No written investing plan? Well, go get that first. If you need help getting an investment strategy in place, consider taking my online course (cheaper but more work required) or hiring a good financial planner (more expensive but less work required.)
The next column requires some work on your part. There are functions that can pull the share values of your investments into the spreadsheet automatically, but we're just going to update manually to start with. So, for your US stock allocation, perhaps you're using the Vanguard Total Stock Market Index Fund, my favorite mutual fund, like many of us. If it is in just one account, go to the account website (you do have logins to your investing accounts, right?) look at the total and type it into that box. But perhaps you hold it in more than one account- your 401(k) and your taxable brokerage account. No problem. Just get the totals from both accounts and add them together. In a spreadsheet, that looks like this:
=42687+98752
and the spreadsheet will do the arithmetic for you. If you want it to look pretty like mine, you'll need to change it to dollars and maybe even move the decimal point over a couple of places so you don't have to look at the pennies unless you want to. In Excel, those buttons look like this:
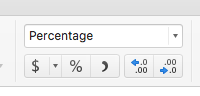
but they'll look similar in other spreadsheets like the free “Google Sheets”, where it looks like this:
The next column is simply your current percentage. In order to get this, you'll need some totals. So let's work on that bottom row for a minute. Write “total” in column one, then in column two, add up the entire column. In spreadsheet speak, that looks like this:
=sum(B2:B6) where it adds up all of cells B2, B3, B4, B5, and B6 and spits out the total in B7. Cool trick eh? Can you believe people used to make spreadsheets by hand? NPR did a fascinating podcast on the history of the spreadsheet. Life-changing for business in this country.
At any rate, Now you can simply copy and paste (control + C on a PC, command + C on a Mac) that box into all of the other boxes in that same row. Now, back to that fourth column.
If you start in the 2nd row of that 4th column, what you're trying to do is to find out what percentage of your portfolio that asset class currently makes up. So you need to divide what is in the asset class (B2) by the portfolio total (B7). If you want it to be a pretty percentage, you just need to highlight the box and hit the % button by that $ button. At any rate, this will make the box look like this:
=C2/C7
You can type similar things (=C3/C7) into each row, or you can use a little shortcut. If you write =C2/$C$7 in D2, then you can just copy that box and paste it into rows C3-7. It will change the C2 to C3 etc, while keeping C7 the same.
The fifth row is your desired assets in that given asset class. This is simply the percentages from your written investing plan (2nd column) multiplied by the portfolio total (still in C7). The first box will look like this:
=B2*$C$7
and you can just copy and paste it to the other boxes in the row.
The sixth column gives you the numbers you are looking for- how much needs to be moved from one asset class to another in order to rebalance. It is simply the fifth column (E2) minus the third column (C2):
=E2-C2
You can copy and paste it to the rest of the column as you have previously done.
Now, you can see that you need to sell $6,702 of US stocks, buy $6,236 of International Stocks, buy $8,214 of Bonds, sell $5,727 of Real Estate, and sell $2,020 of Gold. Super easy if you only have one investment account, but obviously increasingly complicated if you have multiple investing accounts. I'm sure you can figure it out, especially if you start doing this as a resident with a single Roth IRA and only add one account at a time.
Don't like reading words about this stuff? Try this YouTube video:
When to Rebalance Your Investments
Let's pause for a minute and just talk about rebalancing for a second. Perhaps the simplest way to rebalance is to just do so based on time. So every year, maybe on the 1st of the year or on your birthday or whatever, you rebalance your portfolio no matter how much or how little it is out of whack.
The primary benefit of this method is that it requires very little work or portfolio monitoring. In fact, there is some data to suggest that the best rebalancing interval is not even every year, it's more like every 2-3 years. In the past, this interval has allowed for momentum to provide a little boost to the portfolio. Naturally, no one has any idea whether that will also be the best interval in the future.
Some people prefer to rebalance only when the portfolio is really out of whack. One of the most popular rebalancing rules is the “5/25” rule. This says that for large asset classes, such as one that makes up 30% of your portfolio, you rebalance it when it is more than 5% out of whack, meaning if the % of the portfolio in that asset classes either drops below 25% or rises above 35% of the portfolio, then you rebalance the entire portfolio.
For small asset classes, such as one that makes up 5% of your portfolio, you rebalance it when it is more than 25% of its allocation out of whack. So for a 5% asset class, that means you rebalance everything when it hits 3.75% or 6.25% (5% * 25% = 1.25% and 5% +/- 1.25% = 6.25% and 3.75%.
The upside of this method is that you're more likely to buy low after a market dip and sell high after a market rise, but it does require you to monitor your portfolio a little more closely, especially during volatile times when perhaps you shouldn't be looking at your portfolio as much.
Rebalancing Your Portfolio with New Money
The truth, however, is that for most investors in the first half of their accumulation phase, it is very rare that one might need to actually sell an asset class in order to rebalance. They can usually simply rebalance by directing their new investments each month toward whatever asset class is lagging. Whether this is better than simply setting up automatic investments and then rebalancing once a year or not is anyone's guess, but it certainly means more work. Rebalancing doesn't matter THAT much, so maybe it's better to just keep things simple.
Don't Rebalance in Taxable
Since rebalancing doesn't matter all that much, you certainly want to limit (or preferably eliminate) all costs of doing so. Avoid an account where you're paying commissions and maybe even bid-ask spreads. Certainly try to avoid doing it in a taxable account where you may end up realizing capital gains, especially short term capital gains. Since you should be looking at your entire portfolio as one big account spread across all of your (and your spouse's) accounts, most of the time if you have to do any selling of appreciated shares you can do it in a tax-protected account.
Jazzing Up Your Rebalancing Spreadsheet
Ready to move beyond the basic portfolio rebalancing spreadsheet? Let's talk about a couple of ways to make your portfolio a little fancier and easier to use. The OP above wanted his spreadsheet to tell him when he needed to rebalance, and that's pretty easy to do. First, go to the fourth column and turn the text in D2-D6 red. It should look like this:
Now, go to box D2 and we will use “rules” to determine whether the cell is red (needs rebalancing) or green (doesn't need rebalancing) according to the 5/25 rule. Obviously, if you're rebalancing once a year you don't need to do this. So go to “Conditional Formatting” and then “Highlight Cells Rules” and then “Between” as shown
Fill out that form as shown
Note that you'll probably want to use the “custom format” where you can choose the text color and even a fill color if you want. I just changed it to green text with no fill. This will ensure that the text in cell D2 turns green if it is between 25% and 35% and otherwise will be red, indicating a need to rebalance.
In D3 and D4 you would use 20% and 30%, in D5 you would use 11.25% and 18.75%, and in D6 you would use 3.75% and 6.25%. When you're all done, it would look like this:
showing you that you do not need to rebalance. However, if you were just rebalancing with new money and had $10K to invest this month, you would make sure to direct it to US Stocks, Real Estate, and/or Gold.
Let me show you one more cool feature for a rebalancing spreadsheet. What if you didn't have to manually input your level of assets but could pull in that value automatically each time you open up the spreadsheet? It is possible to get your spreadsheet to get into your password-protected accounts, but I probably wouldn't take it that far. It is easier and more secure to just have the spreadsheet pull in the NAV for an investment and manually change the number of shares in the spreadsheet any time you buy, sell, or reinvest dividends in that investment.
While you can use this feature in Excel for PC, it isn't really supported in Excel for Mac, which is what I use. So let's copy and paste our spreadsheet into Google Sheets to show you this one. Add Column G and Column H and label them as “Share Price” and “# Shares”. Fill in Column G with the # of shares, let's say 1203 shares of Total Stock Market Index Fund in G2 and 3703 shares of Total International Stock Market Index Fund in G3. Now, in Column C, you can simply put =G2*H2 into C2 and copy and paste that into the rest of the column.
Now for the fun part. Pick a cell down below your chart, let's say A10 and put in the following:
=IMPORTHTML(“https://finance.yahoo.com/quote/VTSAX/”, “table”, 1)
It will pull all kinds of data from the Yahoo Finance page on the Vanguard Total Stock Market Index Fund Admiral Shares and look like this:
Now go to H2 and put in the following:
=B10
Now the spreadsheet is updating your level of assets automatically each day.
You can follow a similar process for each asset class in the portfolio. Here's what it looks like after doing two asset classes.
Cool trick eh? There are so many fun things you can do with spreadsheets that I bet learning to use one, as limited as my knowledge is compared to the real whizzes, is the most valuable skill, at least dollar-wise, that I've ever learned.
What do you think? Do you have a portfolio rebalancing spreadsheet? What does it look like? Any other great spreadsheet tips for readers? How do you do your rebalancing? Comment below!
Spreadsheet nerds unit! I love this post. But then again, I have been creating these since Lotus 1-2-3 came out. Anyone remember that one?
A key for doctors is to: #1 Don’t obsess over the rebalancing. Just keep making money, saving, and investing. This is tinkering around the edges.
And #2 Don’t sell in accounts outside of retirement funds unless you harvest a loss (TLH).
I plug all my investments manually into the “outside investments” on the vanguard site.
One of these days I will be motivated enough to make my own spreadsheet but right know someone else did the work and it suits my needs.
If someone needed it more customizable then Excell would be the place to go.
Or you can just ask ENT doc very nicely when the forum gets up and running again.
“and am not in a position to develop my own spread sheets.”
you are far nicer than me…..
I love that you taken the time to help teach people these skills, even if it may not be targeting your hard core DIY investor. Bottom line, Excel is a great skill that is likely necessary to make it through school these days but may not be quite as prevalent in older generations.
One more tip while still keeping it super simple: add a “cash” asset class line item, so that you figure out where to invest additional proceeds such as backdoor Roth IRA contributions or dividends that may have built up without being reinvested. Just add another line, put any cash you’re looking to invest into that line item, and set the desired percentage to $0. That will then tell you how much of each of the other asset classes to buy to get the cash down to $0. That way it can handle new contributions and rebalancing. Keep up the good work, WCI!
Good tip.
Wonderful piece. So glad you started with the “Other Chores” as well. I myself find spreadsheets captivating and fun. For those so inclined, feel free to chime in. I have spent “hours” perfecting “productivity enhancements” that would take 15 minutes using a piece of paper and a calculator! Have at it and enjoy.
My point is the “meat of the article” is the techniques in determining when to rebalance. Master the logic of the rebalancing process is where your investment returns will be impacted. For example, the color formatting is not near as important as the the thought process for determining the 25%-35% rules. Spend the “Jazzing Up” time after you have walked through the decision logic. Logic impacts your portfolio.
Wealthy Doc: Cool spreadsheets. Lotus 1-2-3 (with a ton of macros) was the tool used to produce a financial consolidation system for a $30 billion company. Things are more reliable now.
Great that you are providing self-help on the nuts and bolts of managing the investment grunt-work. Spreadsheet skills are useful in so many ways. My usage goes back to the first Excel release, on the Mac, in 1985. I would suggest users reading this post, who are spreadsheet leery, consider taking an introductory class on using spreadsheets. Local tech colleges, community education programs, etc. will likely offer convenient, low cost options. Doing so may reduce frustration and save time.
FWIW, even as a longtime spreadsheet geek, I find it important to backtest my calculations and cell references.
For Mac users, Apple’s Numbers spreadsheet software, has a Stock function that retrieves market info from the internet, as described above for Excel on PCs and Google Sheets. Numbers also has a StockH function that can retrieve historical info.
I also use Apple Numbers. Just note that the Stock function is NOT real-time. Rather, it uses the previous day’s closing price. A bit of a PITA when rebalancing and/or buying/selling ETFs.
For Mac users that have access to Office 365, the latest version of Excel does have stock and mutual fund information lookup. If you have cells with the ticker symbol, you can click on stocks in the Data tab, and then you can put price and other data in other columns.
Thanks! I’ve got the desktop version.
The desktop version that comes with Office 365 (subscription) is what I’m referring to, and it is the same version you get in Office 2019 (non-subscription). Office 365 also allows web editing if you use their cloud to store documents.
I’ll take a look if I ever get 2019! I can still see over half the alphabet on my 2013 keyboard, why upgrade? 🙂
It would be interesting to hear from the original poster, but I’d expect what he/she wanted is considerably more complicated. The real value of this post (thanks for the free fish!) isn’t showing how straightforward the calculations are, it’s illustrating that any greater level of detail isn’t necessary in the first place.
Maybe Vanguard has better reporting, but the tools at Charles Schwab appear to intentionally hide the ball on investment performance and overall returns. It’s hardly better than seeing the portfolio balance over time vs. a handful of market indexes. You can’t (at least I can’t) even distinguish between new money invested and market returns. Without a 3rd party tool, I’m sure many people with poorly performing portfolios aren’t even aware of it.
You might have some luck with Schwab checking out the Portfolio Performance tab from homepage, then “Rate of Return”, followed by “Account Performance.” After navigating to this section on my account, it shows various values such as Beginning Value, Net Contribution, and Change in Value (3 months, YTD, one year, etc). I assume Net Contribution indicates new money invested over your specified time period, and Change in Value would be overall portfolio return during same period.
At first glance, values seem to check out with returns and reinvestment. I noticed a recent Roth rollover value was included in Net Contribution instead of Change in Value.
…Although navigating to other tabs for me resulted in error messages or invalid popup links. The website feature (as of today) seems somewhat buggy!
WCI,
You state this: “So every year, maybe on the 1st of the year or on your birthday or whatever, you rebalance your portfolio no matter how much or how little it is out of whack.”
It got me thinking….Surely someone has done a back tested study to determine which date would have been the best to rebalance over the past 50 or 100 years. I’m sure there is a day/week/month of the year that is best to rebalance compared to others. Ever run in to a study like this? I have to believe it exists with all the financial studies that have been done. Let me know if you find it, so I can set the “best” rebalancing date based on history ;).
It’s not actually best to refinance every year, but rather every 2-3 years. But on which date…hard to say. And even if you could, it wouldn’t mean anything going forward.
I recently made my own spreadsheet using google sheets (last week actually) with a couple extra wrinkles. I spent way too long watching youtube videos on how to use the query function and also made a table that tells me where new money should go.
The query function allows you to focus on two columns (say fund type and amount invested) and sum all the money by fund type. I did this because I didn’t want the extra step of adding two separate TSM funds that are in different accounts. I also can add new funds or new accounts (I’m a resident so I assume many more will be added) and the query function will sum everything just by adding it within my pre-made table. It looks like this (=query(Accounts!B5:F13, “select B, sum(F) group by B”) Where B was the “accounts” column and F was the amount in each column.
The second part was adding a box for “new money.” Say in January I want to invest $10000 but don’t know where to put it. Simply make a function that adds the new investment total to your current total and multiply by your desired asset allocation. The difference between desired and actual is where the money should go.
Seems simple, maybe I’m missing something but I’m excited about it.
Lots of fun tricks to play with eh?
I think you are right that there are many people that will learn from this, including me. I manage all of our own finances (net worth 3.4M), but am not Excel savvy. I am very comfortable and mostly enjoy doing all the chores necessary to be a DIY investor, but because I have not taken the time to learn more than basic spreadsheets I end up doing more manual calculations. I didn’t take the OP comment about not being in a position to create their own spreadsheets in the way others might have. The amount of time and energy it would take me to take a class, Google information, etc to learn how to use Excel for this purpose has zero appeal for me, although I know it would be useful in the long run. For those of us who aren’t spreadsheet nerds, THANK YOU for deciding to educate the rest of us in a simple, focused post that was probably easy for you but will save many of us hours of time that can be spent on other aspects of our finances that we actually enjoy!!
Here is a neat little tool. You can get it and Microsoft APP store for free or at the developer website (also free) with a nice sample spreadsheet.
I could see this being enhances for multiple accounts (401k, 457,roth, taxable) located in different brokers and slice/dice with allociations for the separate or combined catagories you want to track for AA. Build a few downloads from the brokage accounts and use look-ups to link the cost information and cash balances with control totals and you have a little system you can customize for rebalancing, profitability, and monitor your holdings by account and consolidated. I would add a worksheet for each account or a separate section on the data page and use formulas to make the consolidated. Works on Excel 2010 up to 2019. The good thing, no macro’s to maintain and a free commercial APP. The sample workbook has a roadmap for putting it together and the graphs, and instructions. You will add the developer button, but it is easy and requires zero programming or macros.
https://appsource.microsoft.com/en-us/product/office/wa104379220?src=office&corrid=5de2970a-ce6e-432a-a941-dfa3d146d2f7&omexanonuid=1ce42eb8-b658-49c8-85ac-3775948b8447
http://www.michael-saunders.com/stocksapp/pages/info.html#howto
I am curious if, when figuring out your class allocation percentages, you take into consideration that, for example, us stock index funds may have a small percentage in other classes (and this is true for essentially all index funds that I have seen). So for example, VTSAX is not really 100% US stocks – if you look on Morningstar, VTSAX is 98.35% in US equity, 0.93% in non-US equity (i.e., international?) and 0.72% in cash. Do you go to this level in determining your asset class allocation, or is this too much “in the weeds”?
I would definitely NOT. The reason is over simplified in my mind.
The vast majority of large companies have a global business model. Additionally some US companies moved offshore for tax purposes is likely what is driving it. I accept the classification if the index/MF.
Tinkering with that doesn’t seem to provide any advantage.
This post “forced” me to go back and complete the asset allocation spreadsheet I started building months ago . Thank you WCI
A simple answer to the original question could been “just buy a vanguard Target Date Fund”. Average expense ratio 0.12%, basically free and someone else does the work.
You do mention it later on in the post.
But we would never have learned all the neat spread sheet tricks. I use excel for my research so it is pretty easy to extrapolate to my financial life. But my spreadsheets definitely could use some cosmetic touches.
Mine are like my car, a 2009 Camry. My neighbor shared his spreadsheets with me and they are much fancier than mine, probably explains why he drives a Tesla.
Why not just use Personal Capital for this? Link your accounts and it shows you your asset allocation updated in real time. You simply have to figure out how to sell/buy to rebalance occasionally. PC takes probably 50% of the work out of it for you. I assume sig fig is similar.
Call me paranoid (I can take it), but for me, I am not willing to relinquish my passwords to a 3rd party, no matter how safe and secure they say they are, in order to access my personal financial data. That is the main sticking point with me and sites like PC, Mint, or similar sites.
There’s a lot of good tips and tricks there. Thanks for sharing. But it also seems like a lot of work compared to what you can accomplish with using Quicken. I think the investment features of the new subscription format for Quicken have even improved. Have you ever used Quicken?
I haven’t but lots of people like it. Feel free if it helps you.
Excellent article that I’ve used to create my own spreadsheet — thanks WCI. Was wondering what you and others thought of the PoF’s completed spreadsheet he offers on his site (link in middle of page below):
https://www.physicianonfire.com/the-pof-portfolio/
It seems much fancier and cleaner looking than mine – wondering if you or anybody had feedback on its quality? Looks great to me. Thanks!
I think it’s great. Feel free to use it!
I am kind of a spreadsheet “newbie”. I copied =IMPORTHTML(“https://finance.yahoo.com/quote/VTSAX/”, “table”, 1)
from your blog and entered it into A10 of my new excel spreadsheet and got an error message that said “there is a problem with this formula.” What could I be doing wrong? I then copied and pasted the entire spreadsheet into google sheets and tried again to copy the =IMPORT… and got an error message there too. Please help!
I’ve had trouble with that function over the years too so I just started importing that data manually and haven’t gone back to try it again in probably a decade. It doesn’t seem like it would be that hard to do.
Any Idea on how to add value of individual held bonds into a spread sheet? Let’s say I own something like Ibonds and would like to add that and consider it’s value as a part of my portfolio?
Same way you add the value of anything else. Look up the value and put it on the spreadsheet. What am I missing about your question?
I think what AJ might be asking is whether you can do something similar to what the stock connector does in terms of automatically updating the value of the investment? Asked another way, given the bond is paying about 7% interest, at least for the next six months, is there a way to automatically calculate that increase in value in the spreadsheet like how the stock connector updates the value of your stocks based on the current price of the stock? Or do you simply add the purchase price of the Ibond ($10,000) and leave it as is?
I just add the purchase price and leave it as is until Treasury direct gives me a different number to put there. But I’ve only had I bonds for a month now so they’re fairly new to me.
If you wanted to automatically do it I’m sure you could write an equation, at least to get close enough. But what’s the point?
With interest accumulated at around $60 per month on $10k, there is a good chance with the changing rate of YOUR bond will not be accessible. I doubt you can link directly to Treasury Direct and these are not publicly traded.
Put it in the spreadsheet and call it good.
I was just trying to get it update automatically like Tim was saying. I set up my excel to pull the price of stock directly from the web and wrote an equation to multiply the price by the number of shares. That way I only update the number of shares.