By Dr. Jim Dahle, WCI Founder
Estimate how your money will grow by calculating the future value of an investment after years of compounding will help you to make goals and measure your progress toward them. Fortunately, calculating compound interest is as easy as opening up Excel or Google Sheets and using a simple function—the Future Value Formula.
How to Calculate Compound Interest Using the Future Value (FV) Formula
Excel
- Open Excel.
- Click on the Formulas tab, then the Financial tab.
- Go down the list to FV and click on it.
A box will pop up with five values you'll need to fill in.
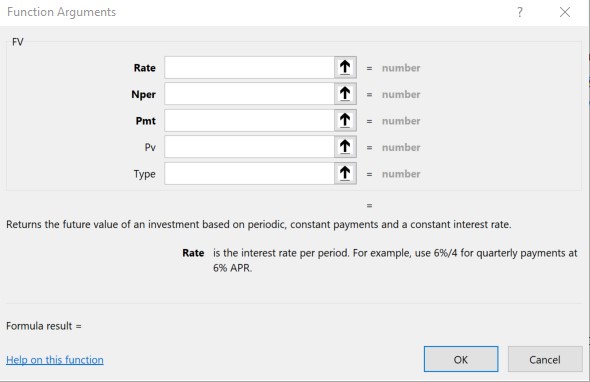
Here's what those five boxes mean:
RATE
This is the interest rate or rate of return. Usually, you can just put in an annual rate of return, such as 5%. If you want to do things on a monthly basis, enter in 5%/12.
NPER
This is the number of periods such as years or months. If you used an annual rate above, put in the number of years, such as 30. If a monthly rate, put in the number of months in the period.
PMT
This is the amount you'll put into the investment on a regular basis each year. Any amount going into the investment should be a negative number, and any amount coming out of the investment should be positive. For example, if you're going to invest $10,000 a year, enter in -10000.
PV
This is the present value of your investment or, in other words, the amount you already have in the investment. If, for example, you already have $50,000 in an investment you'll enter -50000 as the PV.
TYPE
This is the type of payment. If you're putting the money in at the beginning of the year, put in 1. If at the end of the year, put 0 (the default option).
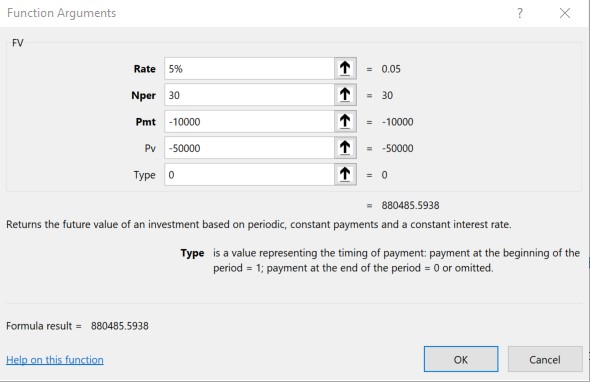
So, to calculate the future value of an investment that starts with a $50,000 balance, and $10,000 is added to it at the end of each year for 30 years, and it earns 5% a year, you will end up with $880,485. It will look like this:
Calculating Future Value in Google Sheets is a little different.
How to Calculate Future Value in Google Sheets
- Open Sheets.
- Click on Insert, then Function, then Financial.
- Select FV from the list and click on it. The spreadsheet will now look like this:
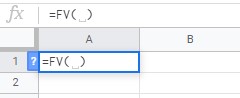
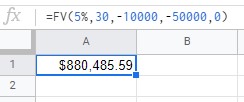
Sheets does not give a prompt to fill in RATE, NPER, PMT, PV or TYPE so you'll need to enter the future value formula in yourself like this:
Playing with Future Value Variables in Excel
Once you've figured out how to calculate with the FV formula, you can play with the variables a little. Say you earn 7% a year instead of 5%. How much more do you get? You'd have $1.33 Million, or about $445,000 more. What if you put in $15,000 a year instead of $10,000 a year? That would earn you $332,000 more. What if you invested that $10,000 at the beginning of each year instead of the end? That would get you about $33,000 more. What if you invested for 35 years instead of just 30? $299,000 more.
Isn't that fun? You'll quickly realize that just a few more years of compounding or just a little higher return can make a huge difference. You also learn that in the beginning it matters much more how much you are adding to the investment (your savings rate) and in later years your rate of return matters much more. You can also see how important it is to get started as soon as possible, to maximize the years of compounding.
What do you think? Have you found the future value formula to be helpful? Why or why not? Comment below!
This is a nice web site that has all the calculators you can think of
Oops, here it is
http://www.easysurf.cc/vfpt2.htm
Very cool. I’ll add that onto the recommended websites page.
When dealing with Future Value calculations and retirement planning (or any financial planning for that matter), one must be very careful when assuming the annual rate of return as that rate is used – as this is assumed each and every year.
For better or for worse, the market is serial in nature and, as a result, an investorr may have several years of positive or negative returns. This will not be reflected in the calculation, causing one to think that they may have a lot more money at retirement.
For example, if I assumed a 35 year old invested a lump sum of $100,000 at 10% compounded annually for 30 years, the future value would be $1,744,940.
However, if I took that same $100,000 and replaced the 10% rate of return with a -20% in any one year, the future value would drop to $1,269,047.
A loss of over $475,000 due to one bad year. I don’t think most people understand just how much volatility can impact the end result when they make these assumptions.
Yes, the sequence of returns is very important to the final amount. Ideally, you would have very high returns for the 5 years before retirement and 10 years after. The worst case scenario is starting a decade long bear market on the eve of retirement.
It’s important to understand the limitations of a calculation like this, but far too many people don’t make the calculation at all!
So neat to be able to do this. But you have a typo:
“So, in our example, the function would end up looking like this: =FV(8%,30,-10000,-50000,0) and the answer would be about $880,485. So if you have $50,000 now, and if you added $10,000 to it at the end of each year for 30 years, and if you earned 5% a year on it, you would end up with $880,485.”
8% return will yield $1.6M according to my calculator.
I probably meant 5% real with a 3% inflation adjustment and didn’t explain it well.
FV, one of the financial functions, calculates the future value of an investment based on a constant interest rate.
Thank you for the useful article.
When I run your formula in excel, I get the same answer. However, when I run it in an online “compounding interest” calculator, I get a different result (913,705.02 in both cases when I tried to run it, rather than the $880,485.59 you came to)
I ran this on 2 separate sites (see below links), so I’m curious as to how the forumula from the online calculator is different from Excel. Any idea on this?
So you want me to trouble shoot the calculators on MoneyChimp and Dave Ramsey? 🙂
I suspect it comes down to when the contributions are made- the beginning of the period or the end.
So let’s try these calculators. Dave’s uses monthly contributions instead of annual, so that’s a pain. So let’s just take the ongoing contributions out of it. If I put in a $100K present value, 5% annual return, no contributions, and a 10 year period, it spits out $162,889.47.
On Moneychimp, those same factors give me $162,889.46. So within a penny.
On Excel, I get $162,889.46. =FV(5%,10,0,-100000)
So they all seem to work just fine. Not sure what happened to you.
We can try it with annual contributions. Let’s just use the moneychimp one since that gives us that option.
Let’s say 5%, 10 years, 100K now, and $10K a year at the beginning of each year.
On MoneyChimp: $294,957.33.
On Excel: =FV(5%,10,-10000,-100000,1) = $294,957.33
Now, let’s put the new contributions in at the end of the period.
On Moneychimp: $288,668.39
On Excel: =FV(5%,10,-10000,-100000,0) = $288,668.39
I dunno. The calculators seem to be working fine for me. Maybe pilot error?
Thanks for the response on thoughts. Yes it does look like you nailed it, the difference with the online calculators vs the formula from the post is that the online calculators are using payment at the beginning of each period. (and as you also pointed out, this can also easily be done in excel by adjusting the formula)
Thanks so much!
Jake
Here are the links
http://www.daveramsey.com/blog/investment-calculator#/advanced_entry_form
http://www.moneychimp.com/calculator/compound_interest_calculator.htm
Nice article.
On google sheets, if you want to see the formula prompts as you put it in, you can click on the small question mark next to the original cell and it will show the formula explanation to you.
Great tip. Thanks!
Thank you! I have been using this formula since Lotus123 (were you born yet then Jim?) but still don’t trust it enough not to also double check it with EXP and POWER and all sorts of even doing it serially to be sure I see over 30 years how it grows… Don’t want to be one year off… Guess I should’ve taken accounting? Or at least a spreadsheet course. Trying to recall what other functions I’d like you to explain so I can finally comprehend them.
Jenn,
Ha! I thought I was the only one here who is old enough to remember using Lotus123.
As a finance super-nerd, I also use an iPhone app called “Vicinno Financial Calc.” It is cheaper than an HP 12c but runs just like it.
Here is another useful post from Jim in the early WCI days that is still useful.
https://www.whitecoatinvestor.com/how-to-calculate-your-return-the-excel-xirr-function/
wow! Lotus to me is a car, had to google it to see what you mean. I remember using quattro pro but Lotus beats it in age by 5 years!
quick ? guys how does the fluctuation and the volatility affect the real return? I am assuming that the longer and deeper the bear markets that your are DCA’ing into, the real return is likely much higher, but would be cool to see by how much. Are there any programs or functions in excel that can model for example VTSAX DCA’ing from 2000-present?
If you put in the data, sure. But there are better tools.
Also you know in this context that “real” just means after-inflation, right? Not clear from your comment.
Yes, meant after inflation when I said “real”. I wish people would just use real return all the time. what also is confusing is even if you use real return, are researchers and programs using historical average inflation of 3%, or actual inflation at that time being studied? In my mind what would be most accurate to have “real” mean the actual inflation at that time period.
Hi,
Thanks for this! I may be a noob but I just want to make sure I am doing this correctly. I am 35 yo planning on working for at least another 30 years.
I included my 403b (maxed @ $19,500 in addition to the ~$11k match from employer), Backdoor Roth for myself/spouse ($12k yearly). For argument’s sake, I will have a 457b starting next year (with $19,500), which I don’t have yet. Did not include HSA, which I may consider next year nor my taxable accounts.
With these numbers at 5% rate and already ~$276,000 in these accounts. = $5,518,025 by age 65 ??
WOW! Is this all compounding interest?
No, some of it is future principal contributions. But yea, if you save a bunch of money and invest it in a reasonable way you eventually get very wealthy. It’s really not that complicated.
=FV(5%,30,-62000,-276000,1) = $5,518,025.07
Hi,
A thought. If I have a ROTH IRA x2, 403b, 457b, HSA and let’s say a taxable account in all different accounts, would the law of compounding interest be the same. In other words, would there be a difference in the final result (let’s say after 30 years) if these were separate accounts vs one big account? If so, do I need to use this formula multiple times?
Thank you
No difference, although you’ll have tax drag in the taxable account you’ll need to account for.
Compound interest is an important financial concept for the investor to understand. Being able to calculate the future value of an investment after years of compounding will help you to make goals and measure your progress toward them.