One of the most important concepts for an investor to understand is that of expected returns. Expected returns are, of course, not guaranteed returns, but an investor who doesn't have any idea of the range of possible future returns is likely to make significant errors in investing.
A common error is to save too little. For example, an investor who expects an investment to return 15% when it only returns 5% will save far too little to reach their goals. Another common error is to buy high and sell low. This occurs when an investor doesn't realize that a risky asset class can drop 40%, 50%, or even more over a relatively short period. The investor panics and sells their investment to a more patient investor with a more realistic view of expected returns.
How to Estimate Investment Returns
How does one estimate future returns? Probably the best place to start is in the past. If you're expecting an investment to return 20% a year but its long-term returns have been only 10% a year, you're likely in for a disappointment. The overall US stock market, the most successful one in the world over the last century, has had a return over the last 100 years of 10.46%, approximately 6.51% in price appreciation and 3.95% in dividends. That number is prior to inflation, taxes, and investment expenses. Inflation alone has been 3.18% a year from 1925-2025, so the “real” (after-inflation) return has been 7.28%. You can subtract taxes and expenses from there. You can quickly see that any adviser who suggests you rely on “10% investment returns” to reach your goals is already setting you up for failure.
Although that is common, some would lead you to believe that even higher returns are possible. Dave Ramsey, for instance, does a fantastic job helping people get out of debt. Unfortunately, once they're out of debt, he has recommended they get into “good growth stock mutual funds,” which will then return them “12% a year.” About a decade ago, there was a bust of a Ponzi scheme in my area where the investors were sucked in by promises of returns of 18% a year. If an investment is promising three times the long-term return of the stock market (which, at one point, lost 90% of its value), you can bet it will be at least three times as risky.
Where Do Investment Returns Come From?
To make matters worse, many investing gurus have cautioned people that the future expected return of the US stock market is far lower than the past returns. To understand why, you need to understand where returns come from. John Bogle, in his investment classic Common Sense on Mutual Funds, teaches that returns come from three components: the dividend yield, the earnings growth of the underlying companies, and the speculative return. Over the long term, the speculative return becomes a non-factor. At times, people are far too optimistic about the stock market, such as in 1999, and they bid stocks up to ridiculous prices. At other times, such as late 2008, people are far too pessimistic, and stocks sell at a discount. But over the long run, these excesses cancel out each other.
So, long-term returns really only come from the dividend yield and the growth of earnings. Remember that from 1925-2025, about 40% of the return came from dividends (3.95%). Now, think about the current dividend yield of the US stock market, 1.2% [2025]. Assuming the earnings growth of the companies that make up the US stock market remains about the same in the future as it has been in the past, long-term returns going forward look to be about 2.8% lower than they were in the past. Is that assumption reasonable?
Well, US economic forecasts for the next several years call for growth of 1.5%-2.7% per year. Luckily, that's an after-inflation number. If the current dividend yield is 1.2% and expected growth is 2.5%, a reasonable long-term expected real return on the overall US stock market would be 3.7% going forward.
Meanwhile, the current yield of the US bond market is 3.8% [2025]. Unfortunately, that's a nominal, pre-inflation number. If you subtract out an expected 2.4% for inflation, you're left with a 1.4% real return. So, a portfolio composed partly of stocks and partly of bonds is likely to have an even lower return than the 3.7% noted earlier.
More information here:Expected Return on Investment per Asset Class
What is an investor to do? There are really only a couple of choices. First, you can save more and for longer. This is probably the safest of the options. As discussed on the future value function post, we see that if you decrease the rate of return, you must increase either the amount added to the portfolio each year or the number of years the portfolio has to compound that return if you hope to arrive at the same place. Second, you can take on more investment risk. There are riskier asset classes than the overall US stock market. In general with investing, higher risk carries the possibility of higher returns. Asset classes such as small stocks, value stocks, and emerging market stocks have higher expected returns than the overall market.
Rick Ferri, in his excellent book, All About Asset Allocation (2006), lists the following expected returns for various asset classes:
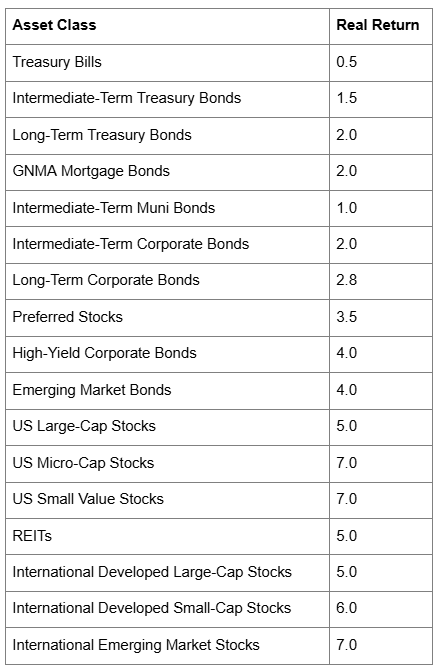
While many would quibble about the actual values in this chart and the wisdom of investing in many of the asset classes listed, the point is clear. If you have a portfolio with a large number of small stocks, value stocks, and riskier international stocks, your expected return (and risk of temporary and permanent loss) is higher than that of one who holds only a US total stock market fund. Also, the lower the percentage of bonds you hold in the portfolio, the higher the expected return.
Naturally, a portfolio composed entirely of emerging market stocks brings its own problems, and it is NOT recommended. Lastly, an investor can hope that “alpha” can be added to their returns. This is the additional return possible from superior security selection and market timing. The number can be positive OR negative, depending on the skill of the manager, and, for all investors as a whole, it's zero before expenses (and well below zero afterward). Unfortunately, the data show that this skill is quite rare, and it probably shouldn't be counted on to add significantly to returns.
More information here:The Bottom Line
To many of you, the expected returns I've discussed above seem quite low. I know how disappointing that can be. But hope isn't much of an investment strategy. Given how low future expected returns could be, it is all the more important that the wise investor reduces the bite of taxes and investment expenses on the portfolio returns.
The bottom line? Have a realistic view of what you can expect from investing over the long term. If you do not, your investment plan will likely result in failure due to your own behavior. Even though 2023 and 2024 returned more than 20% from the stock market, keep in mind that when estimating future returns for your portfolio, use after-inflation, after-tax, after-expense returns that are realistic—such as 2%-6%.
How do you expect the stock market to perform over the next few years? Are you more optimistic than the numbers in this post show? How is it going to affect your investment plan?
[This updated post was originally published in 2011.]