Vanguard recently published a study taken from their internal data about how retail investors invest, called How America Invests. They looked at the holdings of 5.1 million households with a total of $2 trillion in their accounts. Since Vanguard is the largest mutual fund company, this data can be somewhat generalized to the overall population. The study covered the years of 2015-2019, but also included some additional information from the March 2020 COVID-related meltdown. There is a ton of data in the study, but I've chosen to pull out a few interesting factoids that I thought would be worth discussing here.
People Don't Invest Much Money
My first can be taken from the median investor in the study, reproduced in this graphic.

Now, this data is limited by the fact that it only looks at money invested at Vanguard. Obviously, there are many households that also have money invested in 401(k)s or elsewhere that is not at Vanguard. But even so, this is a bit appalling. The median investor is 54 years old, has been at it for 14 years, has one account, has two investments, and has a grand total of $61K. $61K in 14 years, the last 11 of which were mostly a big bull market. If we assume an 8% rate of return, this would suggest the median investor only put
= PMT(8%,14,0,60900) = $2,515 per year
into the account. And half of investors put in even less!
Dave Ramsey likes to say that the main problem people have with investing is that they simply don't invest enough. He uses that fact to justify sending people to commissioned salesmen who sell them loaded, actively managed mutual funds, but it's pretty clear that the fact is true. If these median investors continue to invest $2,515 per year for the next decade before they retire and continue to earn 8% on their money, they'll end up with
= FV(8%,10,-2515,-60900) = $167,912
Per the 4% Rule Guideline this nest egg will now support a retirement income of something like $560 per month. Sounds like a pretty plush retirement, eh? Part of the reason the balances are so low, of course, is that these investors have only been investing for 14 years.
So while $61K doesn't seem like much, remember the median net worth in the country, not counting home equity, is $29K. So at least the median investor who invests at Vanguard has twice that much!
Lesson #1: Start earlier and invest more money.
Investors Take a Lot of Equity Risk
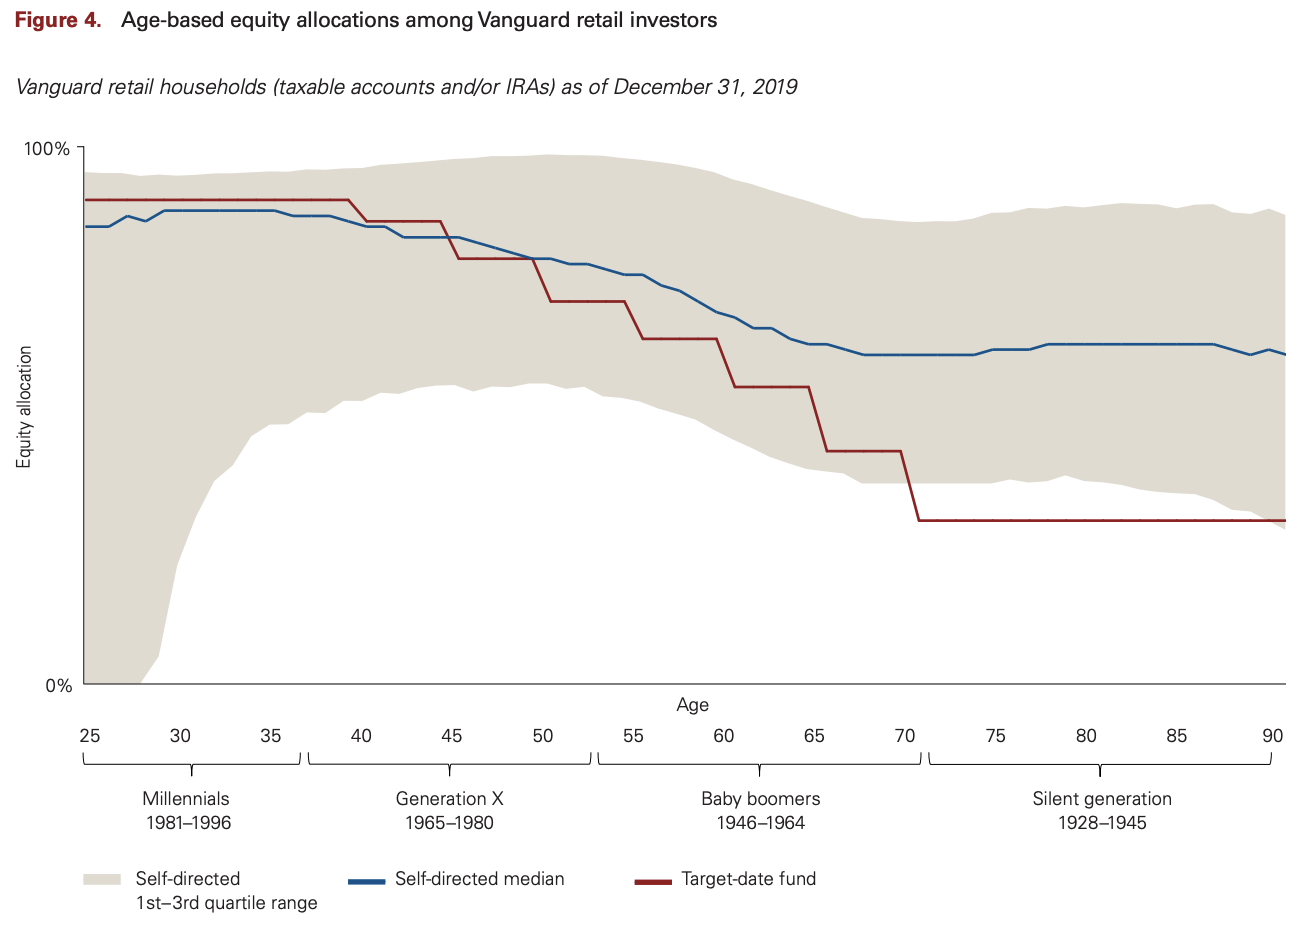
This graph demonstrates the actual asset allocation of self-directed investors (or at least those who are not using Vanguard Advisory Services). I found it pretty interesting, but the most interesting part of it was that the median investor takes significantly more risk than the experts who design the Target Retirement funds would recommend. In fact, 3/4 of retiree investors are taking more than the “recommended” amount of risk.
The other interesting aspect of this graph is the huge range of asset allocations among the very youngest investors. It is hard to tell why these folks are not taking on more risk. It may be due to inertia, inattention, low-risk tolerance, or perhaps saving for short-term goals like down payments. That range tightens up significantly for investors using an advisor:

Lesson #2: Pick a reasonable asset allocation and stick with it.
Young People Know the Benefits of Index Funds
Another interesting fact is shown by this graph:

To really get the message here you need to ignore the top part of the graph, which just shows you how many people have a money market fund. Instead, notice how 80% of the non-cash holdings of 25-year-old investors are index funds but only 15% of non-cash holdings for 90-year-olds. The older you are the less likely you seem to be aware of the benefits of index funds. Perhaps some of this effect can be explained by the presence of “legacy holdings” in a taxable account (those with a low basis where the tax cost is too high to justify switching), but it seems too dramatic a difference for that to be the only explanation.
Lesson #3: Teach your grandpa about index funds.
Investors Chase Performance
Another interesting lesson can be seen by comparing advised clients and self-directed clients when it comes to international equity holdings.

Self-directed clients had a domestic equity allocation of 82%, but advised clients put twice as much money into international equities. This is highly likely to be due to performance chasing, although an alternate explanation is that self-directed investors are just afraid of investing overseas. Of course, the self-directed investors had the last laugh, since US stocks dramatically outperformed international stocks over the time period of the study.
Lesson #4: Don't chase performance, even if it works for a while.
Few Vanguard Investors Are Picking Stocks
Check out this chart.
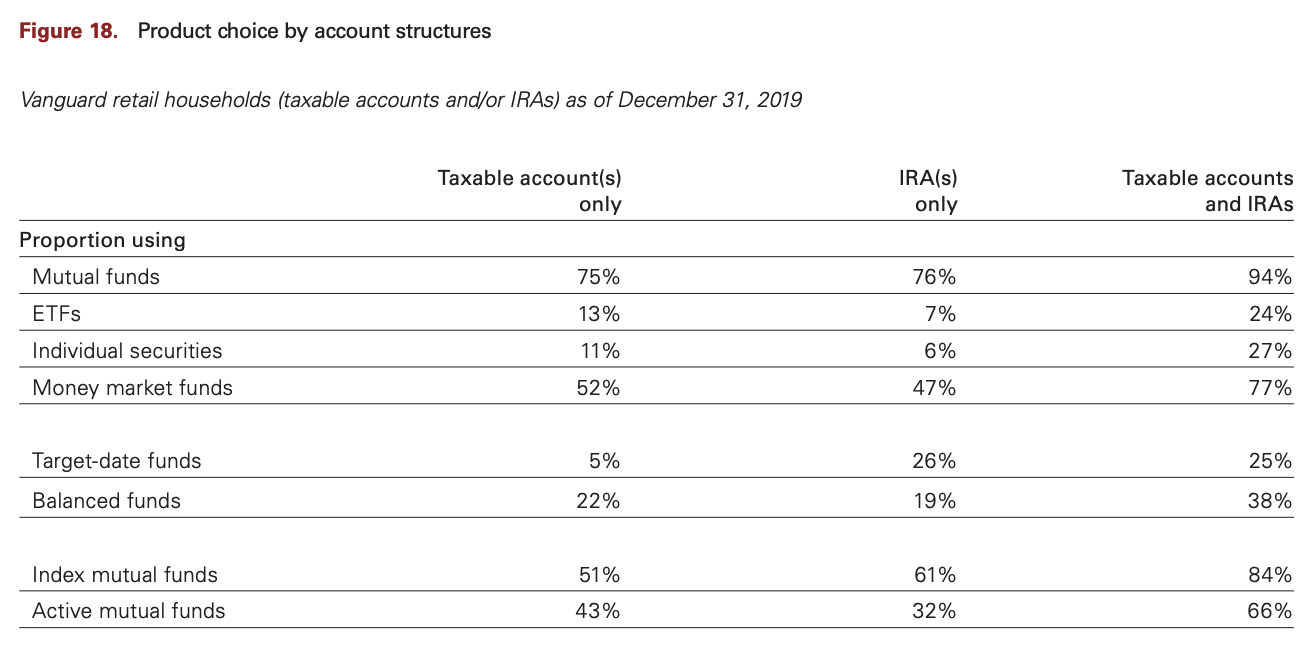
Less than 1/4 of investors are picking stocks. Among investors who only have an IRA, only 7% hold any individual stocks. I find that reassuring, but honestly, if you're a stock picker you probably aren't at Vanguard to start with. Not convinced by that chart? How about this one:

I got a real chuckle out of it. The more money you have in individual stocks, the less money you have. I think there's a lesson there.
Lesson #5: Don't be one of the losers picking stocks.
Vanguard Investors Are Buy and Holders
Perhaps one of the biggest takes from the study was how seldom Vanguard investors trade from one investment to another. Only 22% of investors made even a single trade during 2019.

And even that 22% includes a whole lot of investors (like you and me) that most of us would call buy and holders.

Even the “heaviest trading” category is only 7+ trades a year (4% or so of investors). I figure just rebalancing accounts and normal multi-account asset management accounts for a handful of trades a year. For instance, my household would have been in the heaviest trading category just from tax-loss harvesting in March 2020. It is also interesting that, at least by volume, most trades (99%) are not large market-timing kind of trades.

If you measure by number of trades, only about half significantly change the asset allocation. Only about 2% a year “go to cash”. That's hardly an indicator of “panic selling” at those sorts of percentages. But perhaps the best measure of panic selling can be had by looking at the COVID bear market.

As you can see by comparing the blue line and the red line, there was minimal COVID panic selling.

There was a little more trading in March 2020, but I think a lot of that can be attributed to activities like rebalancing and tax-loss harvesting. If you look at how many people went to cash during the first six months of 2020, it was only 3% (against a baseline level of 2%). Only 12% made their asset allocation less risky (against a baseline of 10%).

Lesson #6: If you are really trading, you are in a tiny minority of Vanguard investors.
Overall, I thought the study was pretty interesting in that it reveals that most investors not only aren't doing much with their investments, but have a lot less trouble staying the course with those investments than one might think. Whether that is due to steely nerves or simple inertia, of course, is anybody's guess.
What do you think? Have you read the study? What stood out to you?